
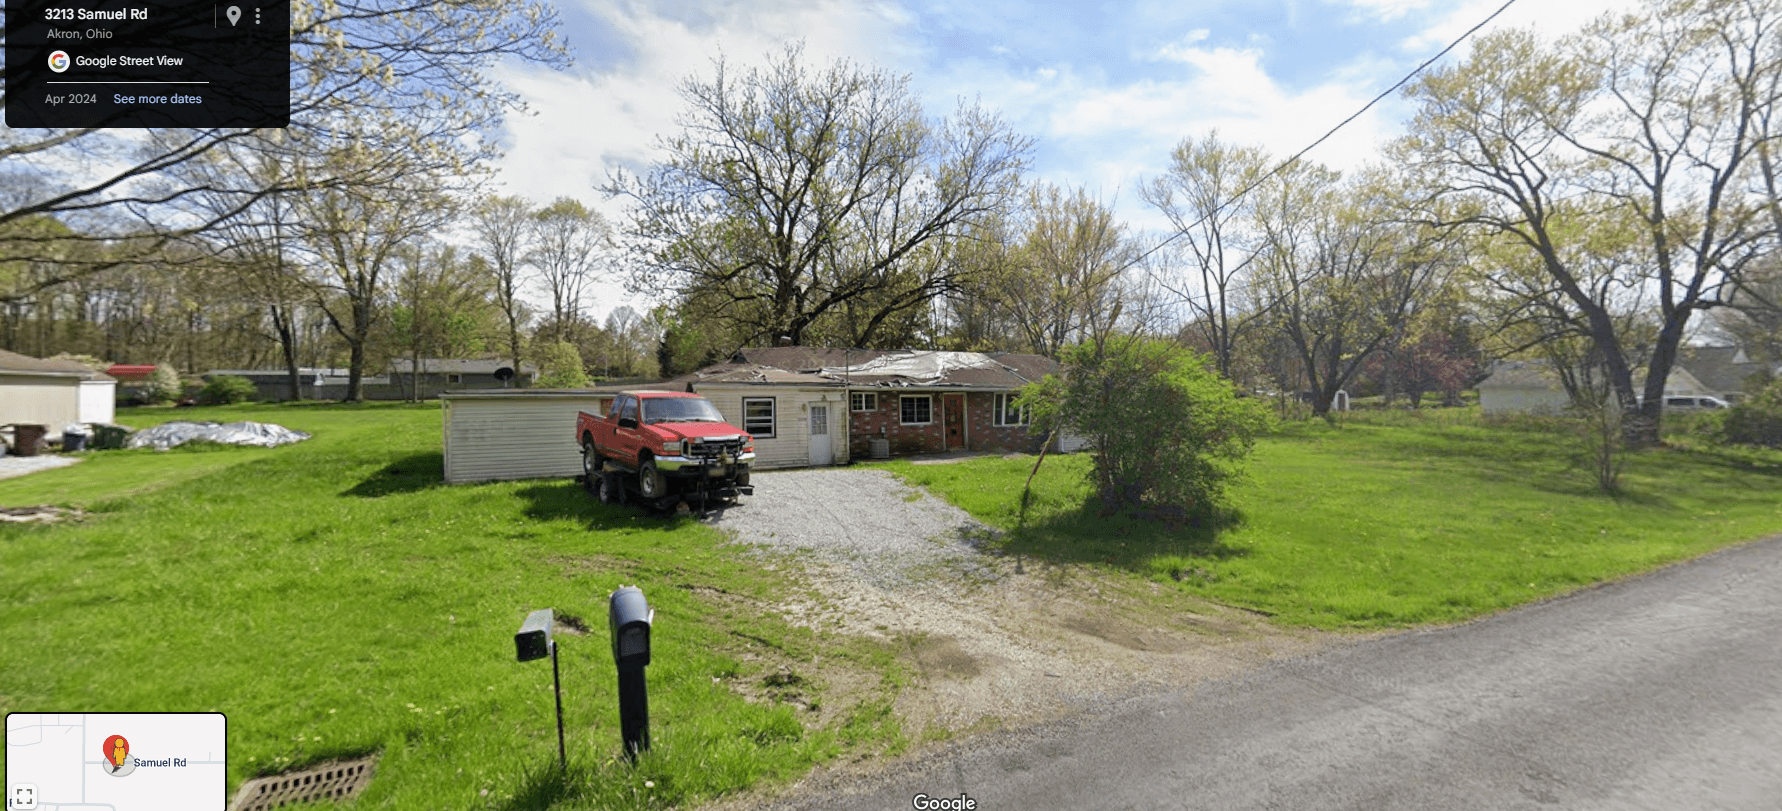
Akron Housing Market Statistics 2026: 40+ verified numbers on home prices, appreciation, ownership, rents, housing age, population, property values, and foreclosure activity in Akron and Summit County, Ohio. Every figure is traced to the agency, association, or data provider that published it, dated, and linked. Last updated September 2026. We update this page as new data is released.
We buy and hold houses in Akron. That means we look at this data every week, and we got tired of finding it scattered across a dozen sites, half of them stale. So we built the page we wanted: one place with the Akron and Summit County housing numbers that matter, sourced to the Census Bureau, FHFA, the Fiscal Office, the local Realtor association, and the data firms that track sales and foreclosures.
If you are a journalist, agent, appraiser, lender, or homeowner trying to answer "what is happening in the Akron housing market," start here. Each number links to where it came from.
Key Takeaways
- The median sale price of a home in Akron was $148,000 over the three months ending May 2026, up 8.2% year over year (Redfin).
- Zillow's typical Akron home value is $141,611, up 3.2% in a year, with homes going pending in about 10 days (Zillow, July 2026).
- Summit County's median sale price was $239,000 over the three months ending June 2026, with homes selling in 21 days (Redfin).
- Akron metro home prices rose 4.79% in the year ending Q1 2026 and 51.57% over five years, against a national gain of 1.7% for the year (FHFA House Price Index).
- Summit County's 2026 reappraisal raised property values an average of 18%, on top of a 31.4% increase in 2023 and 12% in 2020 (Summit County Fiscal Office).
- Akron's 2023 reappraisal raised residential values 40% in the city, the largest jump in a triennial update in the county's history (Summit County Fiscal Office).
- Just 50.7% of Akron housing units are owner-occupied, versus 68.1% for the Akron metro (U.S. Census Bureau, ACS 2020-2024).
- Median gross rent in Akron is $955 per month, and Akron-area rents run about 23% below the national average (Census Bureau; Bureau of Economic Analysis).
- Roughly one in three Akron homes was built before 1940, and the median build year is 1954 (Census ACS data).
- Akron's population is 189,691, down 0.4% since 2020 and down from 199,110 in 2010 (Census Bureau, July 2025 estimate).
- Foreclosure starts in the Akron metro nearly doubled, from 60 in April 2025 to 117 in April 2026, one of the largest year-over-year increases among major metros (ATTOM).
- Ohio had 5,499 properties with foreclosure filings in Q1 2026, up 32.99% from a year earlier, the 9th-highest rate in the country (ATTOM).
What is the median home price in Akron in 2026?
It depends on whether you measure the city or the county, and whether you measure sales or estimated values. Akron proper is the cheapest large city in Northeast Ohio; Summit County as a whole is closer to the national picture because it includes Hudson, Bath, Stow, and the other suburbs.
- Akron median sale price: $148,000 over the three months ending May 2026, up 8.2% from the same period a year earlier. Median price per square foot is $120, up 2.6%. Homes received about 3 offers on average and sold in around 27 days. 619 homes sold in May 2026, down from 650 in May 2025. Source: Redfin, Akron Housing Market, June 2026.
- Akron typical home value (Zillow Home Value Index): $141,611, up 3.2% over the past year, with homes going to pending in around 10 days. Source: Zillow, Akron OH Home Values, updated July 31, 2026.
- Summit County median sale price: $239,000 over the three months ending June 2026, up 0.8% year over year. Median price per square foot is $167. Homes sold after 21 days on market, and 701 homes sold in June 2026, up from 656 the prior June. Source: Redfin, Summit County Housing Market, July 2026.
- Summit County year-to-date median sales price through April 2026 was $224,900, with an average sales price of $275,052. Year-to-date closed sales were 5,471, new listings 8,171, and pending sales 6,206. Days on market until sale averaged 46. Source: Akron Cleveland Association of REALTORS, Summit County Data, April 2026 report.
- Across the tri-county area (Summit, Cuyahoga, Portage), the year-to-date median sales price through July 2026 was $240,000 and the average was $295,911. Year-to-date closed sales were 11,901, with days on market averaging 39 and months' supply of inventory at 2.4, up 9.1% from 2.2. Source: Akron Cleveland Association of REALTORS, July 2026 data.
- Summit County's February median sale price rose from $196,730 in February 2025 to $220,000 in February 2026, nearly 12% in one year, with 2.28 months of supply. Sales volume fell from 359 to 309 transactions over the same period. Source: Summit County MLS data via Realize Team, April 2026.
- The Census Bureau's median value of owner-occupied housing in Akron is $122,000 (five-year average, 2020-2024). Source: U.S. Census Bureau QuickFacts, Akron city.
- On the more current single-year estimate, Akron's median owner-occupied value is $142,200, compared to $237,300 for the Akron metro area, $239,800 for Ohio, and $360,600 for the United States. Akron homes are worth about three-fifths of the metro median and two-fifths of the national median. Source: U.S. Census Bureau, ACS 2024 1-year estimates via Census Reporter.
How fast are Akron home prices rising?
Faster than the country, and it has been that way for several years. The FHFA index is the cleanest long-run measure because it tracks repeat sales of the same houses.
- Akron metro home prices rose 4.79% in the year ending Q1 2026, 0.53% for the quarter, and 51.57% over five years, ranking 74th among U.S. metros for annual appreciation. Source: FHFA House Price Index, MSA rankings, Q1 2026.
- Nationally, home prices rose just 1.7% over the same year, the slowest annual appreciation since the second quarter of 2012. The East North Central division (which includes Ohio) posted the strongest regional gain at 4.4%. Source: FHFA, Q1 2026 House Price Index release, May 26, 2026.
- The FHFA all-transactions index for the Akron metro stood at 268.93 in Q4 2025 (1995 = 100), up from 255.56 in Q4 2024, a 5.2% one-year gain. For perspective, the index was 40.22 in 1976. Source: FHFA via FRED, All-Transactions House Price Index for Akron, OH, updated February 2026.
- Summit County's 2026 sexennial reappraisal raised property values an average of 18% countywide. Some communities saw more; Peninsula rose about 33%. The county reviewed approximately 262,000 parcels, and new values take effect for tax year 2026 on bills mailed in January 2027. Source: Summit County Fiscal Office via WOSU, August 2026, and Signal Akron, July 2026.
- The 2023 triennial update raised Summit County residential values 31.4% on average. The Ohio Department of Taxation had recommended 34%; the county appealed it down. Source: Summit County Fiscal Office via Ideastream Public Media, August 2023.
- In that 2023 update, values rose 40% in Akron, 44% in Coventry Township, 43% in Clinton, 40% in Mogadore, and 39% in Barberton. The biggest percentage increases hit homes valued under $200,000. Source: Summit County Fiscal Office via Akron Beacon Journal, 2023.
- Prior county-wide residential value increases were 12% in 2020 and 8% in 2017. Source: Akron Beacon Journal, 2023.
- Stacking the three most recent revaluations (12%, 31.4%, 18%) on top of 2017's 8%, a Summit County home's assessed value has roughly doubled since 2017. Our calculation from the Fiscal Office figures above.
Who owns and who rents in Akron?
Akron is nearly a 50/50 city. Half the housing is rented, incomes are well below the metro, and people move more often than the national average. That combination is why so many Akron houses change hands off-market.
- 50.7% of Akron housing units are owner-occupied (2020-2024 average), leaving 49.3% renter-occupied. Source: U.S. Census Bureau QuickFacts.
- The Akron metro area's homeownership rate is 68.1%, so the city is 17 points below its own suburbs. Source: U.S. Census Bureau ACS via Data USA, 2024.
- Akron has 94,725 housing units and 86,815 households, with 2.1 persons per household. Source: ACS 2024 1-year estimates.
- Median gross rent in Akron is $955 per month. Median monthly owner costs are $1,141 with a mortgage and $483 without. Source: Census QuickFacts, 2020-2024.
- Akron-area rents are about 23% below the national average. The Bureau of Economic Analysis regional price parity for rents in the Akron metro was 76.8 in 2024 (U.S. = 100). Source: BEA via FRED.
- Akron's median household income is $48,076 (2020-2024, in 2024 dollars), and per capita income is $29,457. On the 2024 single-year estimate, the city's median household income is $48,521 versus $71,364 for the metro and $81,604 nationally. Source: Census QuickFacts and Census Reporter.
- 23.3% of Akron residents live in poverty, nearly double the U.S. rate of 12.2%. Source: Census QuickFacts, 2020-2024.
- 14.5% of Akron residents moved in the past year, about 25% higher than the Ohio and U.S. rates of 11.8%. Source: ACS 2024 1-year estimates.
- 85.1% of Akron residents lived in the same house one year earlier. Source: Census QuickFacts, 2020-2024.
- Renters were 33.9% of Akron households in 2019 by the ACS one-year measure, with a rental vacancy rate of 3.53%, down from a 2005 peak of 12.12%. Source: Census ACS via Department of Numbers.
How old is Akron's housing stock?
Old. Akron was built for the rubber boom, and most of its housing predates the interstate. That matters for repair costs, lead paint, knob-and-tube wiring, clay sewer laterals, and everything else we look at before making an offer.
- About 34.1% of Akron homes were built before 1940, and another 9.1% by 1949. The median construction year is 1954. Only 3.6% of homes were built from 2000 to 2009, 2.2% from 2010 to 2019, and 0.3% since 2020. Source: Census ACS data via Point2Homes.
- The City of Akron's own housing strategy put the pre-1940 share at 35.2% of housing units and the vacancy rate at 14.6% of 97,163 units, lower than Dayton (22.8%), Cleveland (21.5%), Cincinnati (19.1%), and Toledo (14.9%). Source: City of Akron, "Planning to Grow Akron", using ACS 2010-2014 data.
- Within the Akron City School District, 77.6% of housing was built before 1970 and only 4.5% since 2000. Source: National Center for Education Statistics, ACS-ED Dashboard, 2018-2022.
- Statewide, half of Ohio's housing units were built before 1965, nearly one in four before 1940, and more than two-thirds before 1980 (old enough to contain lead-based paint). Over 540,000 Ohio units are vacant (10% of the stock), and only 28% of those are available for sale or rent. Source: Ohio Housing Finance Agency, Housing Needs Assessment.
- Since 2010 Ohio added only 89,897 housing units (1.8%), while urban cores lost housing stock (-1.1%). Source: Ohio Housing Finance Agency.
Is Akron's population growing or shrinking?
- Akron's population was 189,691 as of July 1, 2025, down 0.4% from the April 2020 base of 190,434. Source: U.S. Census Bureau, Population Estimates V2025.
- The 2020 Census counted 190,469 people, down from 199,110 in 2010, a 4.3% decline over the decade. Source: Census QuickFacts.
- Akron peaked at 290,351 residents in the 1960 Census, meaning the city has lost about a third of its population while keeping most of its housing. That gap is where vacancy and distressed inventory come from.
- Population density fell from 3,209.8 per square mile in 2010 to 3,075.4 in 2020 on 61.93 square miles of land. Source: Census QuickFacts.
- Akron's median age is 37.5, younger than the metro (41.2), Ohio (39.8), and the U.S. (39.2). 21.5% of residents are under 18 and 16.0% are 65 or older. Source: ACS 2024 1-year estimates; Census QuickFacts.
- The Akron metro area (Summit and Portage counties) has 321,578 housing units and 303,143 households. Source: ACS 2024 1-year estimates.
How much foreclosure activity is there in Akron and Ohio?
Ohio is a judicial foreclosure state, so every foreclosure runs through the county Common Pleas court and ends at a sheriff's sale unless it is resolved first. That makes the pipeline visible, and 2026 has been a year of rising filings.
- Foreclosure starts in the Akron metro rose from 60 in April 2025 to 117 in April 2026, placing Akron on ATTOM's list of major metros with the largest year-over-year increases. Source: ATTOM April 2026 U.S. Foreclosure Market Report, May 2026.
- Ohio had 5,499 properties with a foreclosure filing in Q1 2026, up 32.99% year over year, the 9th-highest foreclosure rate among states. In April 2026, one in every 2,977 Ohio housing units had a filing, ranking 11th. Source: ATTOM state-rate tables, as compiled by Foreclosure Flips, June 2026.
- Nationally, 118,727 U.S. properties had a foreclosure filing in Q1 2026, up 26% from a year ago. Foreclosure starts rose 20% to 82,631, and bank repossessions rose 45% to 14,020. Source: ATTOM Q1 2026 U.S. Foreclosure Market Report, April 16, 2026.
- In the first half of 2026, 227,548 U.S. properties had foreclosure filings, up 21% from the first half of 2025. The average foreclosure took 563 days, the shortest since 2013. Source: ATTOM Mid-Year 2026 report via HousingWire, July 2026.
- Summit County runs a foreclosure mediation program through the Court of Common Pleas. Homeowners must file an answer and request mediation to participate. Source: Summit County Court of Common Pleas.
- Foreclosure notices for Summit County are published in the Akron Legal News, which is where most local investors first see them. Source: Akron Legal News, Foreclosure Notices.
If you are behind on a mortgage in Summit County, we wrote a plain-English guide to what actually happens in a Summit County foreclosure, including the timeline, the mediation program, and your redemption rights.
What do these numbers mean if you own a house in Akron?
A few things we take from the data, as people who buy here every month.
Your house is probably worth more than you think, and your tax bill is catching up. Three straight revaluations (12%, 31.4%, 18%) mean Summit County assessed values have roughly doubled since 2017. If you have not looked at your equity position since before the pandemic, look now. We covered the drivers in what is behind Akron's price jump.
The market is fast for clean houses and slow for everything else. 27 days on market and 3 offers is the average for a listed, financeable house. A house with a failed roof, a full basement, or a title problem is not in that average. Those sell to cash buyers, and the spread between the two prices is the cost of the repairs plus the risk. We explain how we price that in what happens to your house after you sell to an investor.
Akron's housing stock is old, and old houses with deferred maintenance are the distressed inventory of the next five years. One in three houses here predates 1940. If you inherited one, our guide to selling an inherited house in Akron walks through probate, taxes, and the sale.
How to cite this page
West Hill Home Buyers, "Akron Housing Market Statistics 2026," westhillholdings.com, updated September 2026. Every figure links to its original publisher; please cite the original alongside this page. If a number has been revised by its source, email us and we will update it.
Sources
- U.S. Census Bureau, QuickFacts: Akron city, Ohio and ACS 2024 1-year estimates via Census Reporter
- Federal Housing Finance Agency, House Price Index Q1 2026 and Akron MSA index via FRED
- Summit County Fiscal Office reappraisal figures via WOSU, Signal Akron, and Ideastream
- Akron Cleveland Association of REALTORS, Housing Data
- Redfin, Akron and Summit County housing market pages
- Zillow, Akron Home Values
- ATTOM, Q1 2026 U.S. Foreclosure Market Report
- Ohio Housing Finance Agency, Housing Needs Assessment
- City of Akron, Planning to Grow Akron
- Bureau of Economic Analysis, Regional Price Parities for Akron rents via FRED
Own a house in Akron or Summit County and want a real number for it, not a Zestimate? Request a cash offer from West Hill Home Buyers. We buy as-is, we keep what we buy, and our name stays on the deed.